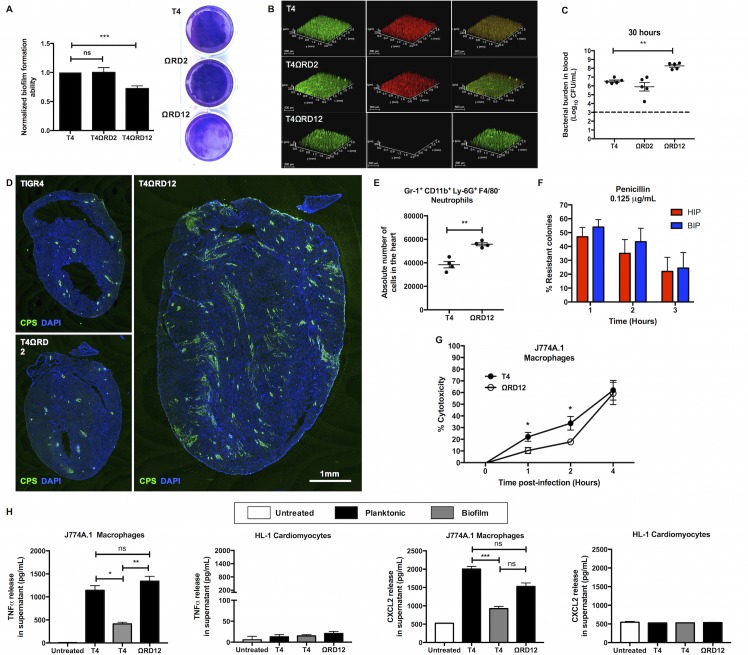
Fig 6. Deletion of RD12 abrogates TIGR4 biofilm formation in vitro, results in a pro-inflammogenic phenotype in vivo, and elicits a stronger immune response from macrophages.
(A) Static biofilm-forming ability of isogenic RD2 (T4ΩRD2) and RD12 (T4ΩRD12) deficient mutants relative to TIGR4 (T4) was assessed in a 48-hour 6-well polystyrene plate model (n = 7 experiments). Biofilm biomass was measured using crystal violet staining. Statistical analysis was performed using Student’s t-test. Shown is a representative image of crystal violet stained biofilms. (B) Representative Z-stacked images of TIGR4, T4ΩRD2, and T4ΩRD12 biofilms grown on coverslips for 24 hours. Biofilms were examined for viability using Live/Dead staining. Whole (live and dead) bacterial biomass stain green whereas non-viable bacteria stain red (n = 3 experiments). (C) Pneumococcal titers in the blood of mice (n = 5 per group) infected with TIGR4 (T4), T4ΩRD2 (ΩRD2), or T4ΩRD12 (ΩRD12) 30 hours post-infection. Mann-Whitney test comparing the mutant strain titers to the wildtype TIGR4 titers was performed. (D) Representative immunofluorescent stained images of cardiac sections from mice infected with TIGR4 (T4), T4ΩRD2 (ΩRD2), or T4ΩRD12 (ΩRD12) 30 hours post infection (n = 5 mice per group). Cardiac sections were stained using serotype 4 capsule polysaccharide antisera (green) and DAPI (blue). (E) Absolute numbers of infiltrated neutrophils in hearts of mice (n = 5 per group) infected with TIGR4, and T4ΩRD12 (ΩRD12) 30-hours post-infection. Neutrophils were identified as Gr-1+CD11b+Ly-6G+F4/80- cells. Statistical analysis was performed using student’s t-test. (F) In vitro antimicrobial tolerance assays for survival of paired blood-isolated pneumococci (BIP) and heart-isolated pneumococci (HIP) from T4ΩRD12 infected mice (n = 5). Tolerance to penicillin and erythromycin killing at the designated concentration was tested. Statistical analysis was performed using Mann-Whitney test. No statistically significant differences were observed. (G) LDH release cytotoxicity assay of J774A.1 macrophages challenged with equal biomass of TIGR4 (T4) and T4ΩRD12 (ΩRD12) as determined at 0, 1, 2, 4 hours post-infection (n = 3 biological replicates, each with 3 technical replicates). Statistical analysis for comparisons of cytotoxicity at each time point was performed using Mann-Whitney test. (H) TNFα and CXCL2 production by J774A.1 macrophages and HL-1 cardiomyocytes following 4-hour exposure to an equal biomass of planktonic TIGR4 (T4), biofilm TIGR4 (T4), or planktonic T4ΩRD12 (ΩRD12) (n = 3 biological replicates, each with 3 technical replicates). Statistical analysis was performed using non-parametric One-way ANOVA (Kruskal-Wallis Test). P value: * ≤ 0.05, ** ≤ 0.01, *** ≤ 0.001; data are represented as mean ± SEM.

