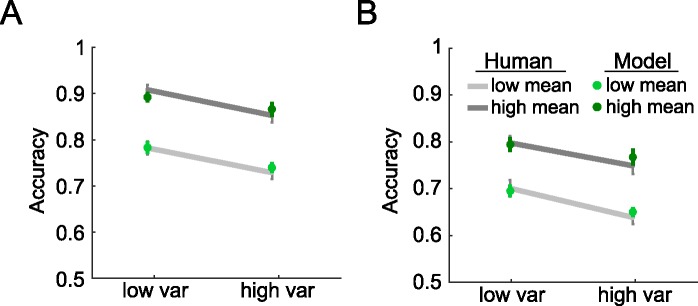
Fig 2. Model and human data.
Mean accuracy and the standard error of mean of human (grey lines) and model (green dots) for high and low variance conditions, with low mean (i.e. orientation close to the reference; light grey lines) and high mean (dark grey lines). Panel A shows performance in the fixed reference session, and the panel B shows the variable reference condition.

