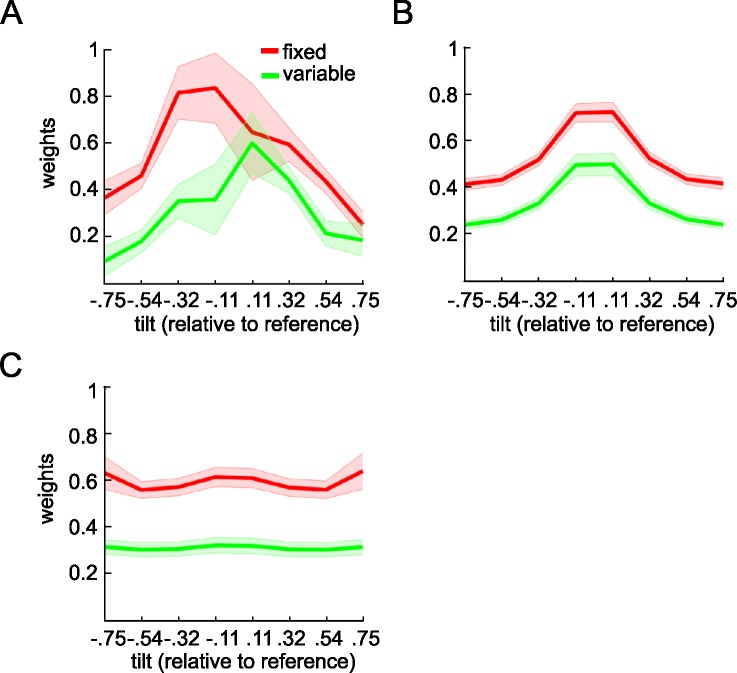
Fig 3. Parameter estimates of orientation of each grating relative to the reference.
The y-axis shows parameter estimates for a probit regression in which the angles of orientation of each grating (relative to the reference) were used to predict choice. Angles were tallied into 8 bins, from most negative to most positive relative to the reference, so that each parameter estimate shows the relative weight given to a particular portion of feature space. The x-axis shows the bin center of each bin. The inverted-U shape of the curve is a signature of robust averaging. Shaded areas are the standard error of mean. (A) Weighting functions estimated using human choices (B) Weighting functions for recreated model choices using the best fitting parameters from the power model using the best fitting parameters from human data. (C) Weighting functions for simulated model choice under a case in which angles are linearly mapped onto DV.

