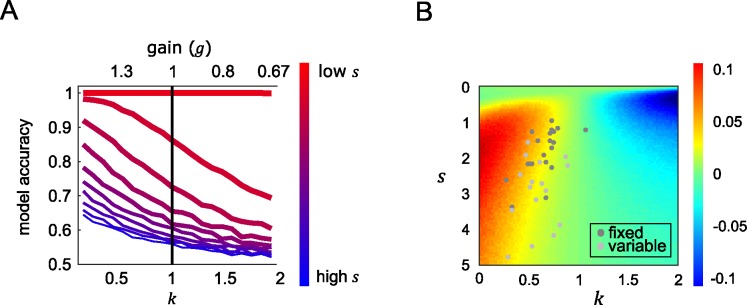
Fig 5. Model accuracy.
(A) Simulated model accuracy for the power model under different values of exponent k (bottom x-axis, corresponding g is plotted on the top x-axis) and late noise (s; in a range of 0.05 to 5) in coloured lines with reddish (bluish) lines show simulations with lowest (highest) late noise. The black line is the accuracy of the model when items were allocated with equivalent gain and equally integrated (k = 1) (B) After simulating model accuracy of the equivalent gain linear model, performance difference between the power model and the linear model is shown in the coloured surface. Positive values (yellow-red) show parameters where the nonlinear model performance is higher than equivalent linear variants, and negative values (cyan-blue) show the converse. Best fitting k and s for each subject of the fixed (dark grey dots) and variable reference session (light grey dots) were displayed to show the performance gain relative to using linear weighting scheme.

