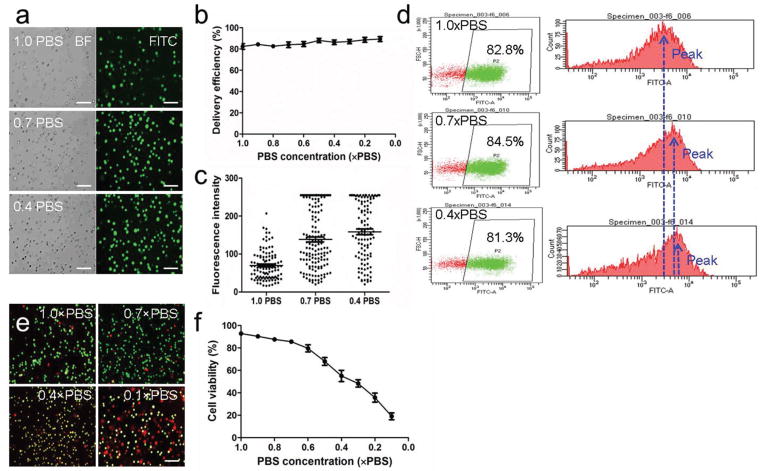
Figure 3.
Optimization of PBS concentrations. a) Images of FITC-dextran (70K) delivered cells in different PBS solutions. Scale bar, 100 μm. b) Delivery efficiency in different PBS solutions. c) Fluorescence intensity of delivered cells in different PBS solutions. d) Flow cytometry analysis of cancer cells delivered in different PBS solutions. e) Images of live/dead staining of delivered cells. Green dots represent live cells and red dots represent dead cells. Scale bar, 100 μm. f) Cell viability of delivered cells in different PBS solutions.

