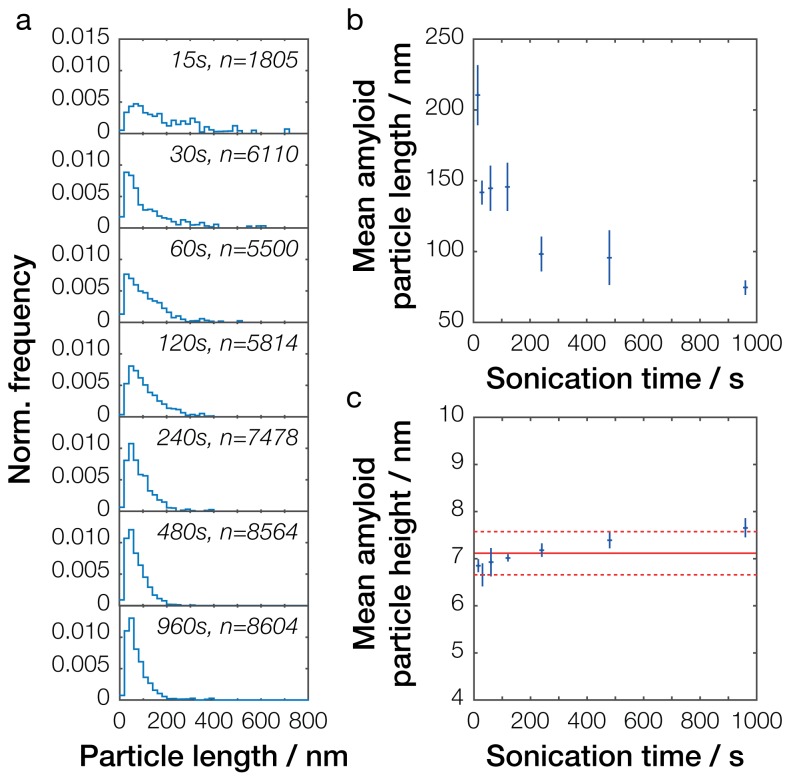
Figure 4. Single-particle analysis of Sup35NM fibril length distribution after controlled sonication.
(a) Particle size distributions for seven representative Sup35NM samples sonicated for different times. The occurrence of different particle sizes was normalized against the total number of particles traced for each individual sample and plotted against particle length (blue lines). Sonication time and the number of fibrils analyzed for each sample are displayed in each plot. (b) Relationship between mean particle length and sonication time. Each data point represents the mean of all individual samples analyzed for a given time point. Error bars represent the standard error of the mean. (c) Relationship between mean particle height, representing the width of the fibril particles, and sonication time. Each data point represents the mean of all individual samples analyzed for a given time point. Error bars represent the standard error of the mean. The mean height of all values is represented by the solid red line, with its standard error represented by the dotted red lines.


