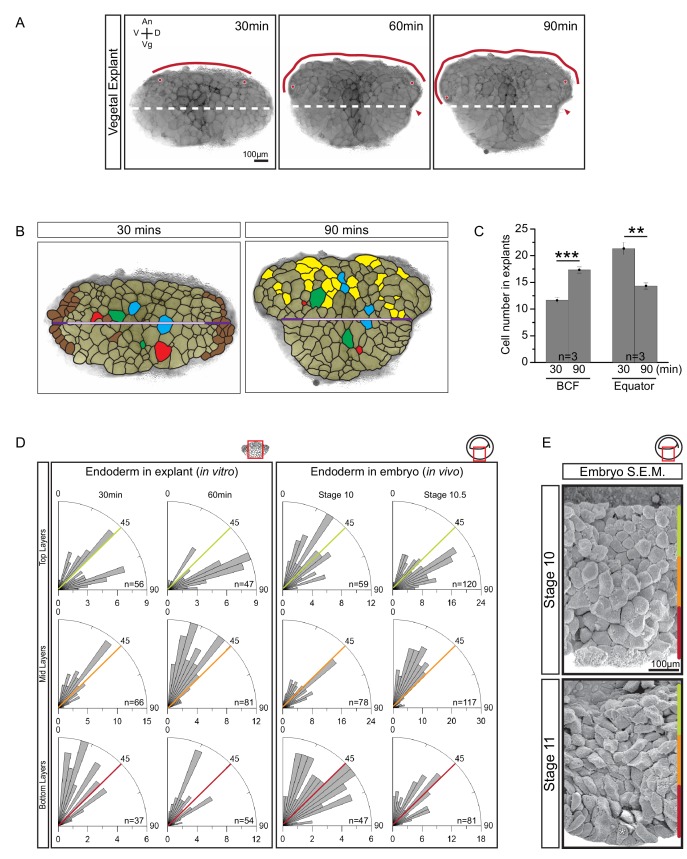
Figure 2. Cellular basis of vegetal rotation.
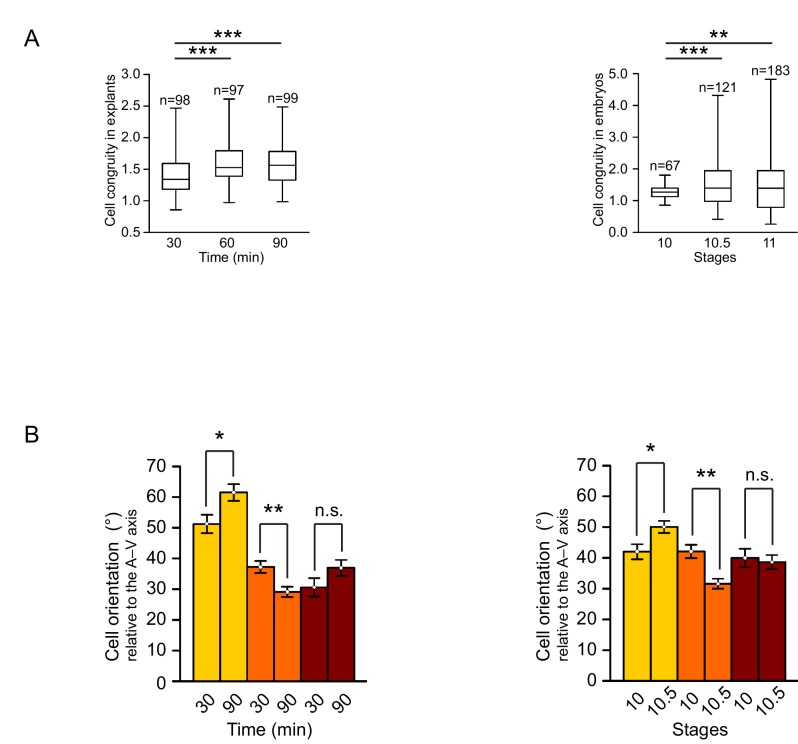
(A) Tissue autonomous movement in live explants. Blastocoel floor (BCF) expansion was followed in explants (red line). BCF length was determined by tracking positions of peripheral endoderm cells (red dots). The equatorial waist (white dashed line) at the explant mid-point runs at the level of the dorsal blastopore (red arrowhead). Animal (An) is to the top, vegetal (Vg) to the bottom, ventral (V) to the left, and dorsal (D) to the right. (B) Cell behaviours in explants. Cells are outlined for the explant shown in Figure 2A, and morphogenetic cell behaviours from 30 to 90 min are indicated (coloured cells). Elongated marginal cells (purple zones) are shown with respect to the cells of the vegetal cell mass (white zone) of the equatorial waist (white and purple solid line). Cells that disappeared from the surface (Brown), cells that emerged at the surface from deep layers (Yellow), cells undergoing division (Blue), cells that reduced their area at the surface as they migrated into deep layers (Red), and cells that increased their surface as they spread out during migration (Green) are shown. (C) Quantification of cell numbers at the BCF and equatorial waist. Error bars indicate S.D. (D) Quantification of cell orientation. Rose diagrams indicate the number of cells in explants (left) or in embryos (right) oriented at given angles relative to the A–V axis in the top (yellow), mid (orange), and bottom (red) cell layers. At stage 10, the endoderm has an average of twelve cell layers, which were evenly divided into three regions. The lengths of bars indicate the number of occurrences in 5° bins. (E) Endoderm cells depicted in scanning electron micrographs of mid-sagittally fractured gastrulae. An apically constricted epithelial surface cell is indicated (asterisk). Corresponding stages are indicated on the left. A schematic of the region of interest (red box) is indicated in the top right corner of select panels. A ruler corresponding to the approximate position of top (yellow), mid (orange), and bottom (red) cell layers is shown in each panel. Panels show data from 14 embryos collected from different egg batches.


