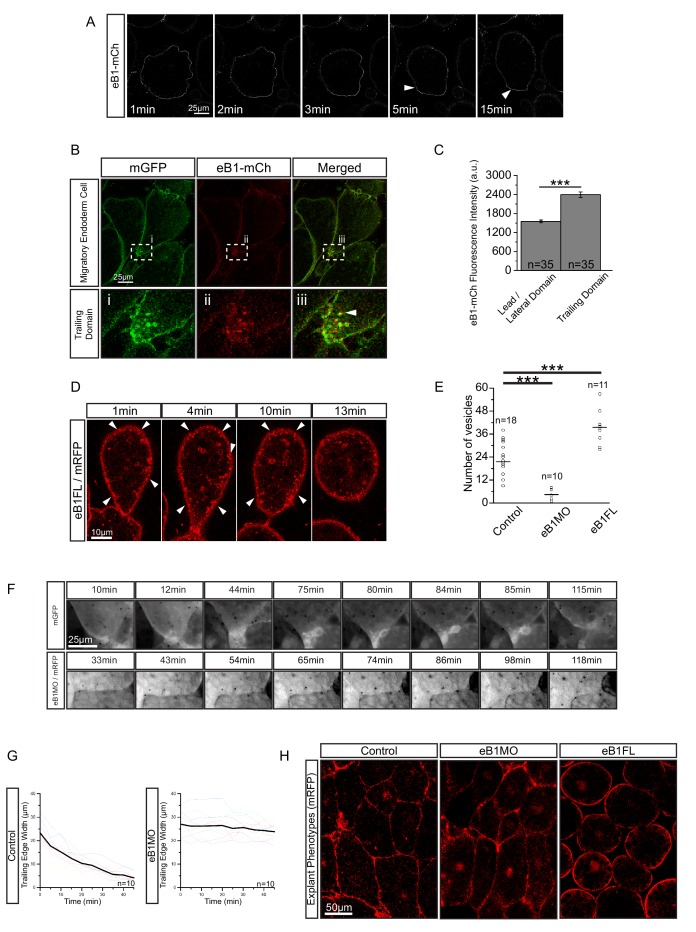
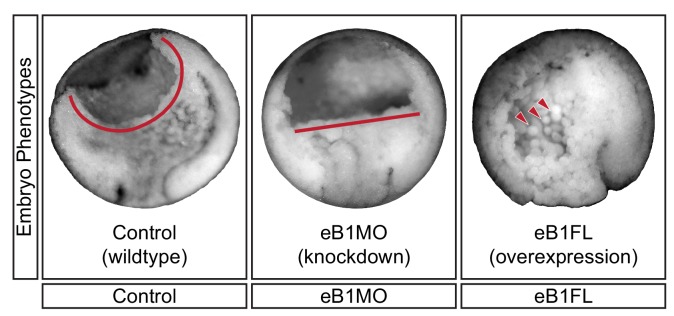
Figure 9. EphrinB1 involvement in endosome biogenesis.
(A) Time-lapse sequence of ephrinB1-mCherry distribution following explantation. After 5 min, ephrinB1 (eB1) has become enriched at the trailing membrane (white arrows). (B) Co-localization of ephrinB1 with endosomes (top row). Higher magnification (bottom row, i–iii) shows that ephrinB1 is enriched near endosomes (white arrow). (C) Quantification of ephrinB1-mCherry fluorescence intensity relative to mGFP at different plasma membrane domains. Bars indicate S.E. (D) Overexpression of full-length ephrinB1 (eB1FL) in membrane-labelled cells causes aberrant vesicle formation at the entire cell cortex (white arrows). (E) Quantification of vesicle number at the trailing edge of uninjected (control), ephrinB1-morpholino (eB1MO) injected, and eB1FL mRNA-injected cells. (F) Trailing edge membrane tapering during retraction. Uninjected cells show typical recession behaviour (top row), while the rear of eB1MO-injected cells remains blunt (bottom row). (G) Quantification of trailing edge width in uninjected (left) and eB1MO-injected (right) cells. Average rate change is shown (black line). Colours represent individual cells. (H) Morphology of uninjected (left), eB1MO-injected (center), and eB1FL mRNA-injected (right) labelled (mRFP) cells in live explants. Animal is to the top, vegetal to the bottom. For C, E, and G, plots show data sampled from five embryos collected from different egg batches.


