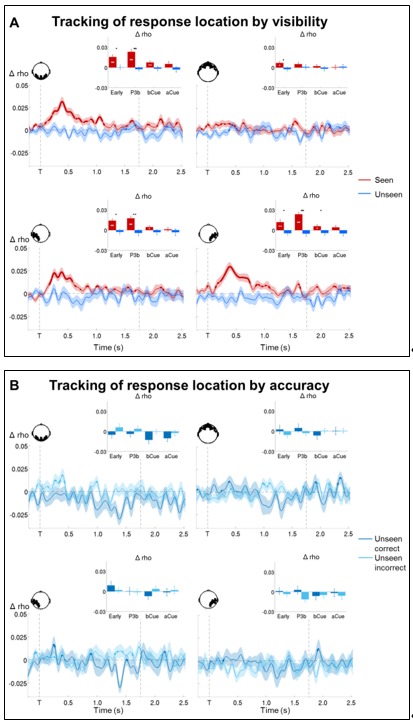
Author response image 3.

(A) Time courses for circular-linear correlations between MEG signals and response location combined across data from 29 participants for seen (red) and unseen (blue) trials. In the replication study, a visual cue was presented 1.75 s after the presentation of the target stimulus, indicating specific response modalities. (B) Time courses for circular-linear correlations between MEG signals and response location combined across data from 29 participants for unseen correct (dark blue) and unseen incorrect (light blue) trials.
