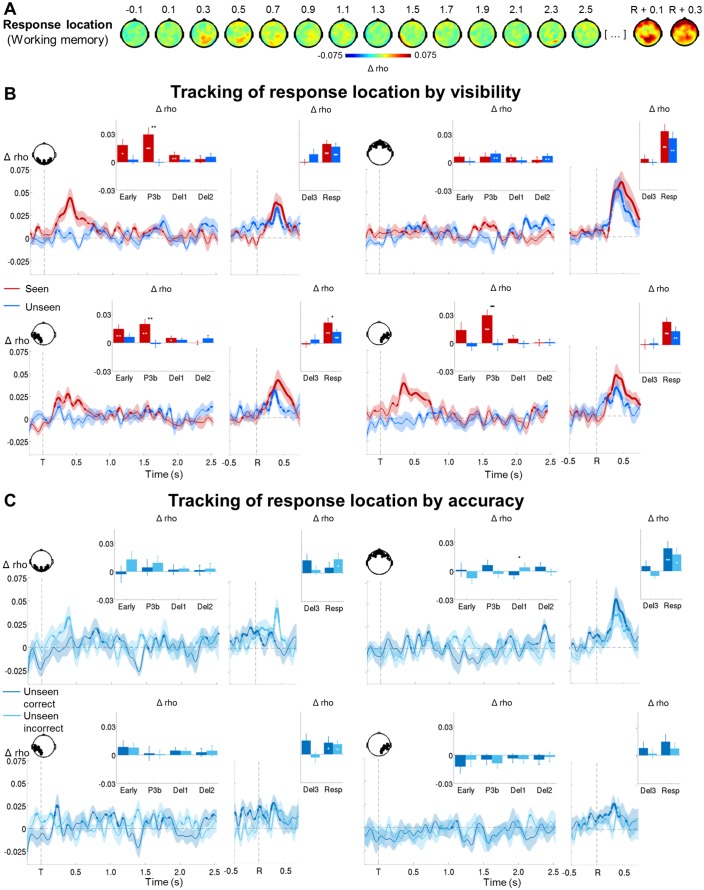
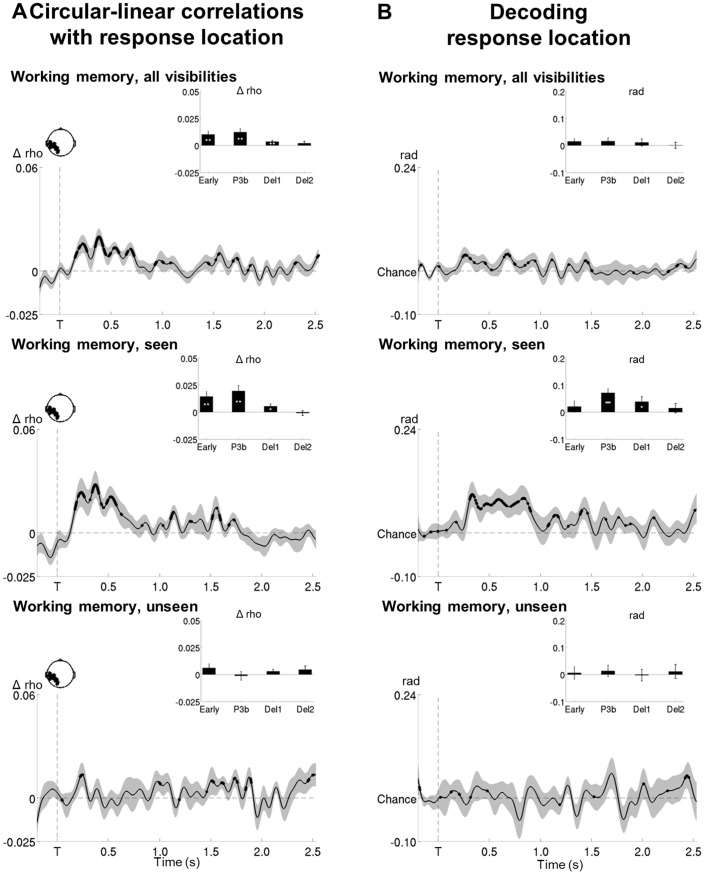
Figure 6. Tracking response location in conscious and non-conscious working memory.
(A) Topographies of average circular-linear correlations between the amplitude of the MEG signal (gradiometers) and response location. R = onset of the response screen. (B) Average time courses (left: stimulus-locked, −0.2–2.5 s; right: response-locked, −0.5–0.8 s) of circular-linear correlation coefficients between the amplitude of the ERFs and response location as a function of visibility in the working memory task in a group of occipital (top, left), frontal (top, right) left temporo-occipital (bottom, left) and right temporo-occipital (bottom, right) gradiometers. Shaded area demarks standard error of the mean (SEM) across subjects. Thick line represents significant increase in correlation coefficient as compared to an empirical baseline (one-tailed Wilcoxon signed-rank test across subjects, uncorrected). Insets show average correlation coefficients (relative to an empirical baseline) in four stimulus-locked time windows, 100–300 ms (early), 300–600 ms (P3b), 0.6–1.55 s (Del1), and 1.55–2.5 s (Del2), and two response-locked time windows, −0.5–0.0 s (Del3) and 0.0–0.8 s (Resp). White asterisks denote significant differences to baseline (one-tailed Wilcoxon signed-rank test across subjects), black asterisks significant differences between conditions (two-tailed Wilcoxon signed-rank test across subjects). For display purposes, data were lowpass-filtered at 8 Hz. *p<0.05, **p<0.01, and ***p<0.001. Del1= first part of delay, Del2 = second part of delay, Del3 = last 500 ms before response screen, R = response screen onset, T = target onset. (C) Same as in (B), but as a function of accuracy on the unseen trials (correct = within ±2 positions of the target).


