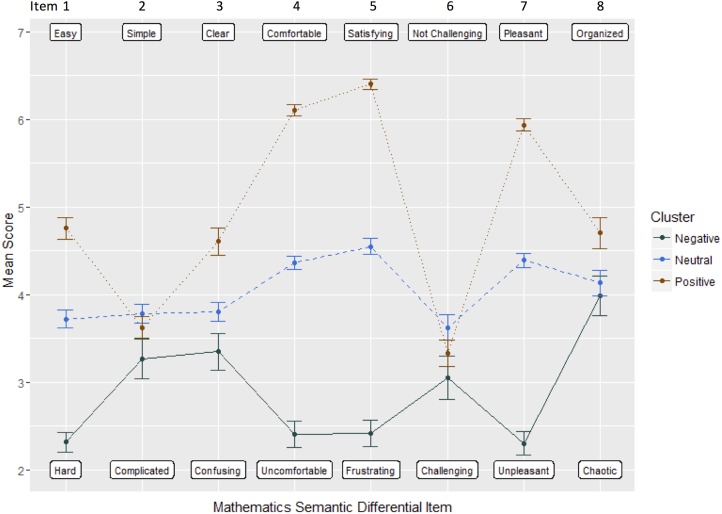
FIGURE 2.
Item means for each cluster from the latent profile analysis. Item numbers are displayed at the top, and cluster means are displayed on the y-axis. These results suggest that three subpopulations, or clusters, are represented in our sample: those who have strongly favorable emotions about math, those who have strongly unfavorable emotions about math, and those who are neutral. In addition, students’ emotions about math seem unrelated to whether they find math intellectually difficult, i.e., all three clusters show similar responses to items 2 (simple–complicated), 3 (clear–confusing), and 6 (challenging–not challenging).

