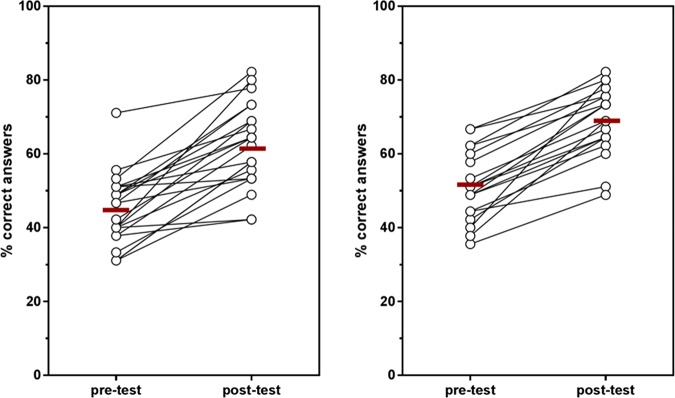
FIGURE 1.
Performance of individual trainees on the pre- and posttest knowledge exam in (left) 2016 (n = 22) and (right) 2017 (n = 19). Open circles represent percent correct for each individual, and lines between columns represent matched pre- and posttest scores for each individual. Red horizontal lines represent the mean percent correct for all trainees. No significant differences were observed between graduate students and postdoctoral fellows at pretest or posttest in 2016 or 2017 (2016 pretest: GS M = 44.5 and SD = 10.8, PD M = 44.4 and SD = 7.5, t(20) = 0.008412, p = 0.9934; 2016 posttest: GS M = 59.3 and SD = 10.7, PD M = 68.3 and SD = 10.5, t(20) = 1.852, p = 0.0789; 2017 pretest: GS M = 49.4 and SD = 8.7, PD M = 52.5 and SD = 10.1, t(17) = 0.7154, p = 0.4841; 2017 posttest: GS M = 70.5 and SD = 10.2, PD M = 67.8 and SD = 9.0, t(17) = 0.6069, p = 0.5520).

