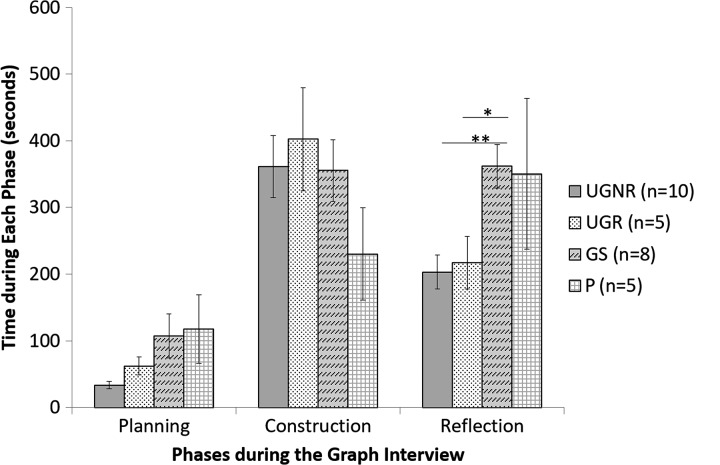
FIGURE 1.
A comparison of the amount of time spent in each interview phase by undergraduate students, graduate students, and professors that summarizes the time spent during the planning, construction, and reflection phases for professors (P, n = 5), graduate students (GS, n = 8), undergraduates with research experience (UGR, n = 5), and undergraduates without research experience (UGNR, n = 10). An independent-samples t test shows there was a significant difference in the amount of time spent reflecting between GS and UGR (*, p < 0.05) and GS and UGNR (**, p < 0.01).

