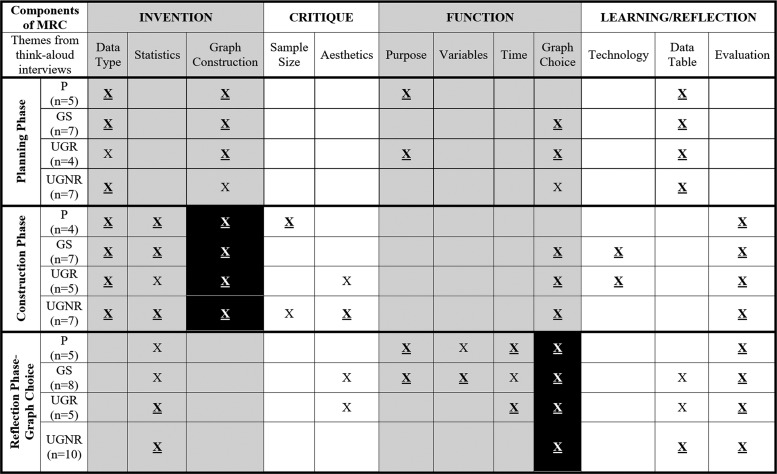
FIGURE 2.
Summary of graph-construction reasoning findings showing the presence of themes in each of the three interview phases by professors (P, N = 5), graduate students (GS, N = 8), undergraduates with research experience (UGR, N = 5), and undergraduates without research experience (UGNR, N = 10). “X” denotes the presence of a theme by one participant; “X” indicates the presence of a theme by multiple participants. Because invention involves graph construction and participants were explicitly asked to reflect on graph choice, these themes are blacked out. Refer to Figures 2, 3, and 4 for themes that appeared for each participant. Small n in the table is a subset of the total sample (N) of the participant group.

