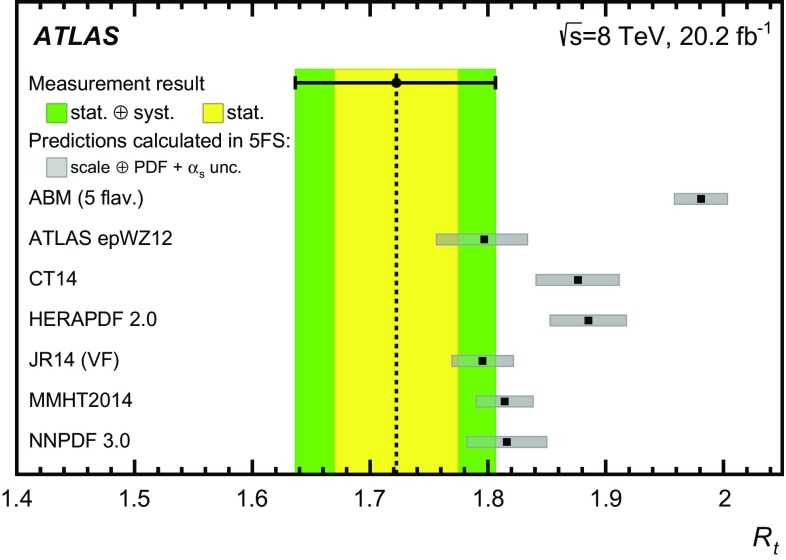
Fig. 11.
Predicted values of calculated with HatHor [14] at NLO accuracy in QCD [15] in the 5FS using different NLO PDF sets [79–85] compared to the measured value. The error bars on the predictions include the uncertainty in the renormalisation and factorisation scales and the combined internal PDF and uncertainty. The dashed black line indicates the central value of the measured value. The combined statistical and systematic uncertainty of the measurement is shown in green, while the statistical uncertainty is represented by the yellow error band. The uncertainty in the measured value does not include the PDF components for this comparison

