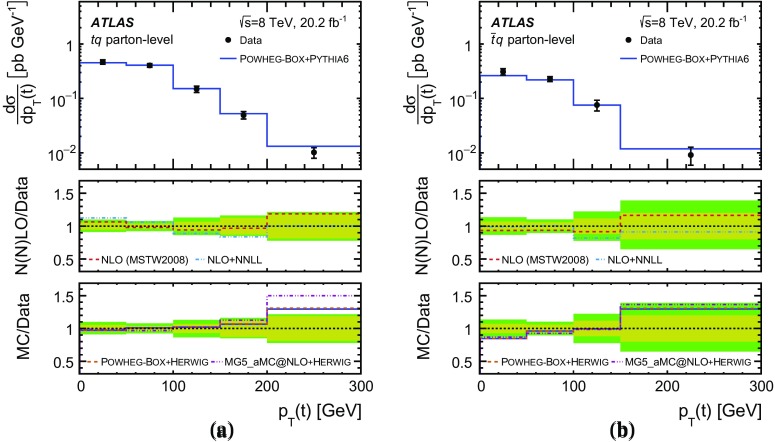
Fig. 21.
Absolute unfolded differential cross-sections as a function of for a top quarks and b top antiquarks. The unfolded distributions are compared to QCD NLO and NLO + NNLL calculations as well as various MC predictions. The vertical error bars on the data points denote the total uncertainty. The dashed (red) line in the central distribution shows the NLO prediction calculated using MCFM. The dash-dot (blue) line is the NLO + NNLL prediction [25]. The bottom distribution compares the data with the MC predictions from Powheg-Box (orange dashed line) and MadGraph5_aMC@NLO (purple dash-dotted line). The inner (yellow) band in the bottom part of each figure represents the statistical uncertainty of the measurement, and the outer (green) band the total uncertainty.

