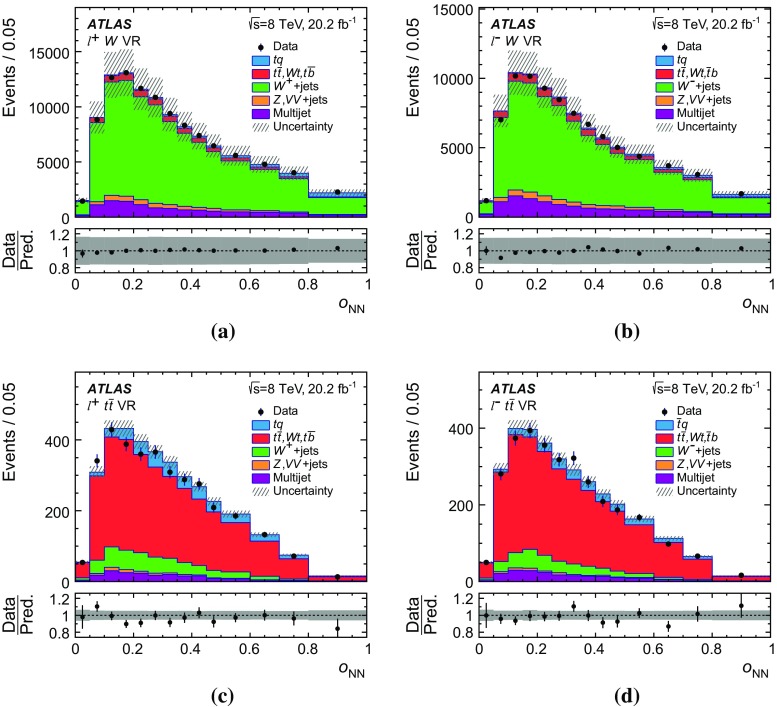
Fig. 5.
Observed distributions (a, b) in the + jets VR and (c, d) in the VR compared to the model obtained from simulated events. The simulated distributions are normalised to the event rates obtained by the fits of the distributions as described in Sect. 6. The hatched uncertainty band represents the uncertainty in the pre-fit process cross-sections and the bin-by-bin MC statistical uncertainty, added in quadrature. The lower panels show the ratio of the observed to the expected number of events in each bin

