
Figure 2. Longitudinal Data Analyses to Assess Change in Thickness with Time.
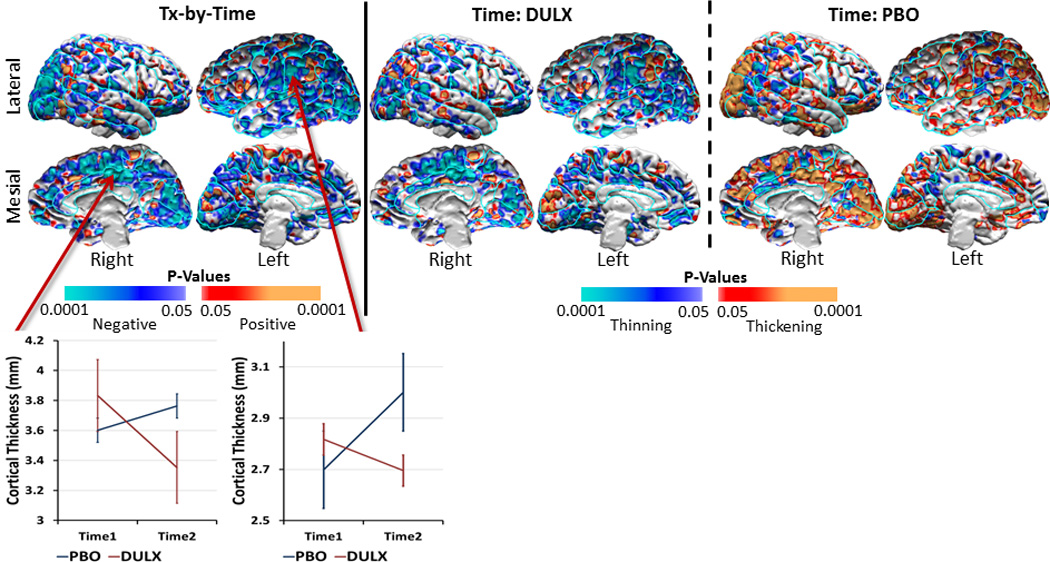
We used linear mixed models to assess the change in cortical thickness with time in the 41 dysthymic patients. Findings showed a significant treatment-by-time interaction on the cortical thickness (left panel), which was driven primarily by a decline in cortical thickness over the trial in the duloxetine-treated patients (middle panel) and a slight increase in thickness in the placebo-treated patients, especially in the occipital cortex bilaterally (right panel). Warm colors (orange and red) show thickening, cool colors (purple and blue) show thinning, and gray shows no significant change in thickness with time. We showed time effects only in voxels where we detected significant effects of treatment-by-time interaction on cortical thickness to understand better treatment effects over the 10-week period of the clinical trial. See Supplementary Figure 1 for maps of time effects across the entire cortical surface. Line graphs for representative locations in the right occipital cortex and right mesial parietal cortex illustrate the opposing change in thickness with time for patients in the two treatment arms. At baseline, the variance of the cortical thickness did not differ between duloxetine-treated patients and placebo-treated patients (scatterplot at mesial location: F-statistic=1.11; df1=19; df2=20; p=0.81; scatterplot at lateral location: F-statistic=0.65; df1=19; df2=20; p=0.36). At the end of the trial, the variance did differ between the two treatment arms for the lateral location (F-statistic=1.53; df1=19; df2=20; p=0.35) but was significantly different for the mesial location (F-statistic=0.31; df1=19; df2=20; p=0.016).
DULX=Duloxetine; PBO=Placebo