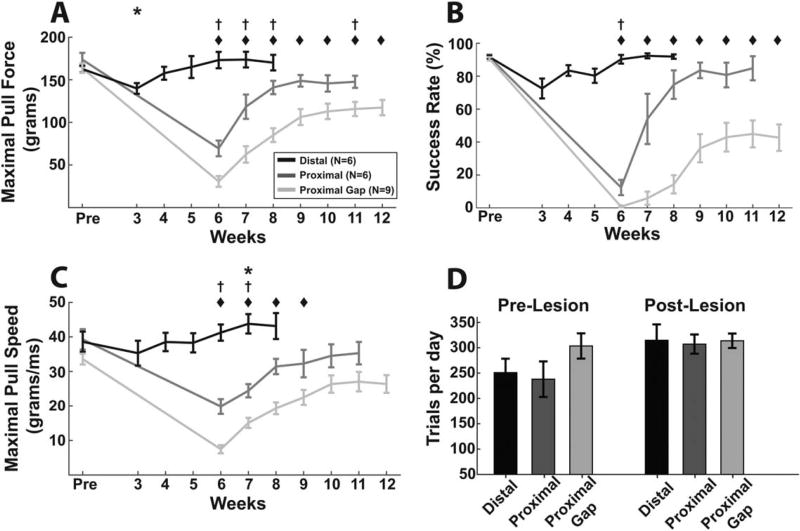
FIGURE 2.
Multiple PNI models resulted in varying degrees of transient and chronic impairments in metrics of forelimb function. Maximal pull force (A), success rate (B), and maximal pull speed (C) each show varying degrees of impairment dependent on lesion. (D) Animals performed several hundred trials per day across groups, with no reduction in trials performed following lesion. All plots show group averages, and error bars indicate ± SEM. *P < 0.0083 for the distal group, †P < 0.0083 for the proximal group, ◆P < 0.0071 for the proximal gap group for each time point compared with prelesion levels in panels A–C.

