
Fig. 3.
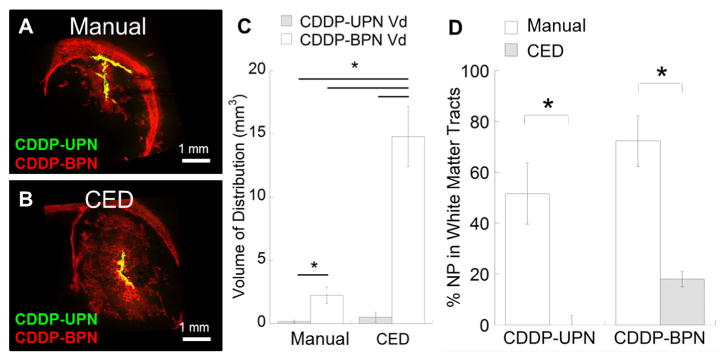
In vivo distribution of CDDP-UPN and CDDP-BPN following local administration. Representative confocal images of CDDP-UPN (green) and CDDP-BPN (red) following administration via (A) manual injection or (B) CED (N ≥ 3 for each administration). NP overlay is depicted as yellow. Scale bar = 1 mm. (C) Volume of distribution (Vd) of CDDP-BPN and CDDP-UPN following manual injection or CED. Calculations were conducted using image-based MATLAB quantification. *p < 0.05 denotes statistically significant differences. (D) Distribution of CDDP-BPN and CDDP-UPN present in WMT as a percentage of total distribution. Higher % of both NP formulations are found in WMT when administered using a manual injection as opposed to CED (*p < 0.05). (For interpretation of the references to color in this figure legend, the reader is referred to the web version of this article.)