
Figure 1. Expression of SNX10 in mouse tissues and cells.
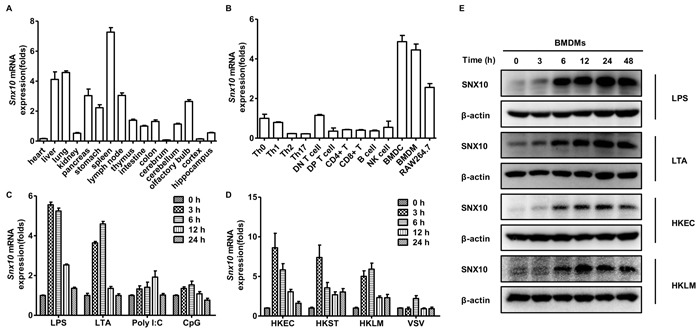
A., B. Q-PCR analysis of Snx10 expression in various mouse tissues A. and cells B.. C., D. Q-PCR analysis of Snx10 expression in BMDMs stimulated with LPS (100 ng/mL), LTA (2 μg/mL), Poly I:C (20 μg/mL), or CpG (0.3 μM) C. or infected with HKLM, HKEC, or HKST at a MOI of 20 or VSV at MOI of 1 D. for the indicated times. Data were normalized to the expression of the GAPDH gene. E. Immunoblot analysis of SNX10 protein levels in lysates of BMDMs stimulated with LPS (100 ng/mL) or LTA (2 μg/mL), or infected with HKEC, HKLM at a MOI of 20 for the indicated times. β-actin was used as a loading control. Data are representative of three independent experiments with similar results.