
Figure 3. Co-culture alters miRNA concentrations.
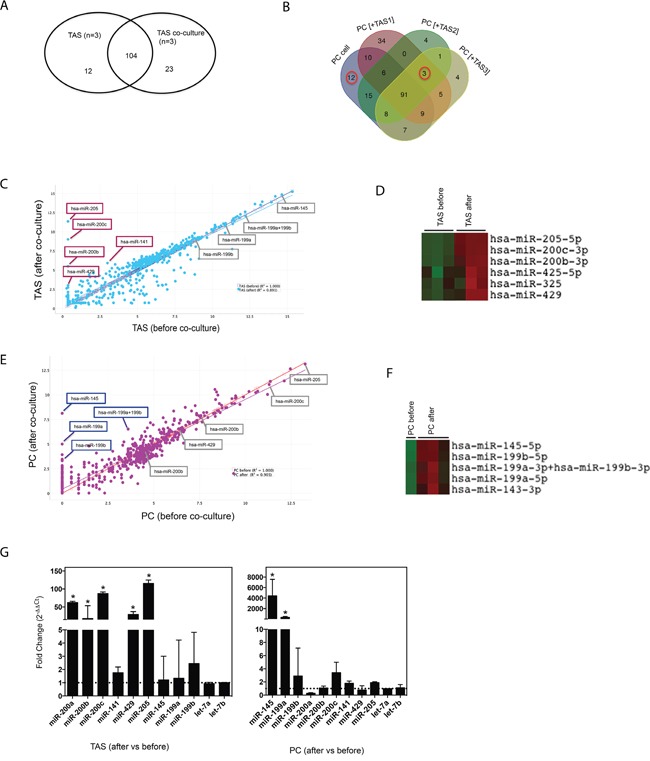
Venn diagram comparison for miRNA expression in TAS (A) and in PC cells (B) before and after co-culture. Scatter plot analysis depicting miRNA expressions in TAS cell lines (C) and PC cells (E) before and after co-culture. All miRNAs of interest are indicated. Data are plotted as log2 digital signal readings. r2: coefficient of determination (square of correlation of coefficient). (D) & (F) Representative clusters of miRNAs (rows) on cells before and after co-culture (columns). (G) qRT-PCR confirmation of miRNAs of interest in TAS cells (n=6) and PC cells (n=4). Fold changes were calculated using ΔΔCt method comparing specific miRNA expression levels in cells after co-culture with levels in cells without co-culture. Bars show mean ± SD. * p < 0.05.