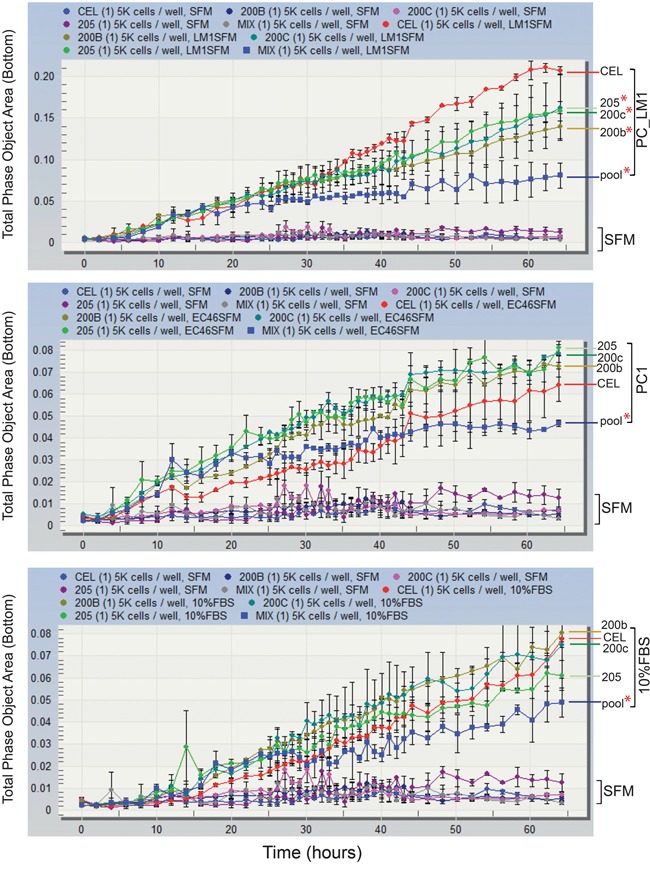
Figure 5. Pooled expression of miR-200b/-200c and -205 inhibits TAS cells migration.

TAS cells transfected with control (CEL) or individual specific miRNAs (miR-200b, -200c or -205) or the combination of the three (pool) were plated at a density of 5000 cells per well in the upper chamber of the ClearView cell migration plate. Serum-free conditioned medium from PC_LM1 (top panel), a cell line derived from a PDAC liver metastasis and PC1 (middle panel), a cell line derived from a primary neoplasm were added to the bottom reservoir. Serum-free (SFM) and 10% FBS supplemented medium (bottom panel) were served as negative and positive controls. Total phase cell-covered area was measured and plotted against incubation time (hours). Differences of migrated cells covered area between specific miRNA transfection to control miRNA (CEL) were compared and statistically analyzed. Red * indicates p < 0.05.
