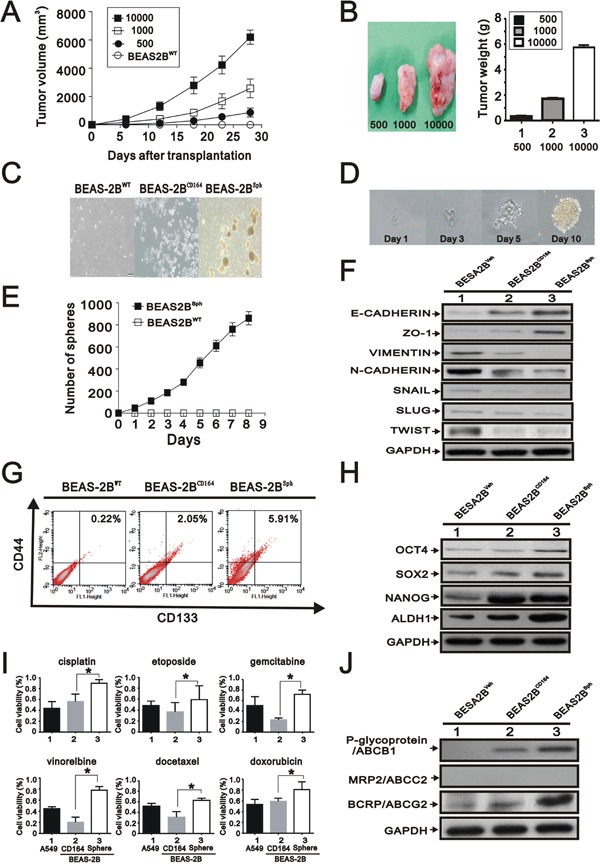
Figure 4. The effect of overexpression of CD164 on the stem cell-like properties.

A. Representative tumor-growth curves of xenografts derived from different cell numbers (n=5, each group). B. Quantification of tumor weight formed by different cell numbers of BEAS2BCD164 cells. All values were expressed as mean ± SEM. *P < 0.05 indicates statistical significance. C. Representative images of BEAS2BWT, BEAS2BCD164 and BEAS2Bsph cells. D. One spheroid cell generated from single-cell culture in 96-well plates. E. Time course of primary sphere formation after culture in ultralow plate for 8 days. The results were the means ± SEMs of three independent experiments. F. Immunoblotting analysis of the indicated proteins in BEAS2BVeh, BEAS2BCD164, and BEAS2Bsph cells. G. Flow cytometry for analyzing the expression of CD133 and CD44. H. Immunoblotting analysis of stem cell makers in BEAS2BVeh, BEAS2BCD164, and BEAS2Bsph cells. I. The chemoresistance of BEAS2Bsph and BEAS2Bsph cells were performed using MTT assay. All values were expressed as mean ± SEM. *P < 0.05 indicated statistical significance. J. Immunoblotting analysis of ABC transporters in BEAS2BVeh, BEAS2BCD164, and BEAS2Bsph cells.
