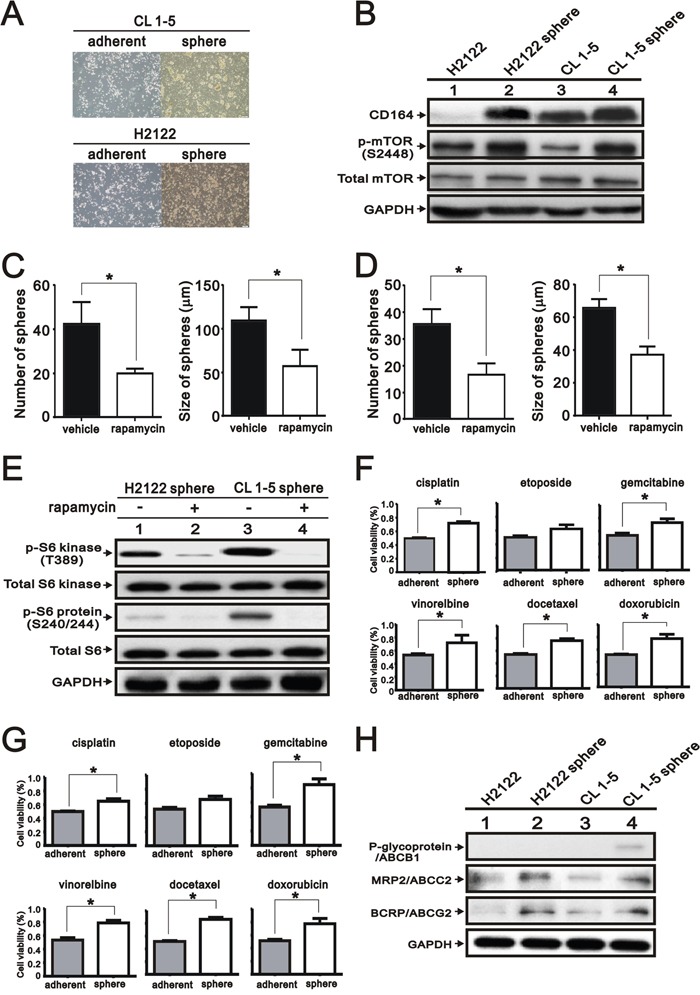
Figure 8. Expression of CD164 in the lung tumor sphere cells.

A. Representative photographs of spheroid cells and adherent cells of H2122 and CL 1-5. B. Immunoblotting analysis was utilized to determine the protein levels of CD164 and mTOR in the spheroid cells of H2122 and CL 1-5. C. The number and size of CL 1-5 spheres formed in the ultralow plate were determined in the absence or presence of 30 nM rapamycin. All values were expressed as mean ± SEM of three independent experiments. *P < 0.05 indicated statistical significance. D. The number and size of H2122 spheres formed in the ultralow plate were determined in the absence or presence of 30 nM rapamycin. All values were expressed as mean ± SEM of three independent experiments. *P < 0.05 indicated statistical significance. E. Immunoblotting analysis was used to determine the mTOR pathway in the spheroid cells of H2122 and CL 1-5 treated with vehicle or rapamycin. F. The chemo-resistances of H2122 spheroid cells and adherent cells were performed using MTT assay. All values are expressed as mean ± SEM of three independent experiments. *P < 0.05 indicated statistical significance. G. The chemo-resistances of CL 1-5 spheroid cells and adherent cells were performed using MTT assay. All values were expressed as mean ± SEM of three independent experiments. *P < 0.05 indicates statistical significance. H. Immunoblotting analysis of ABC transporters in the spheroid cells and adherent cells of H2122 and CL 1-5.
