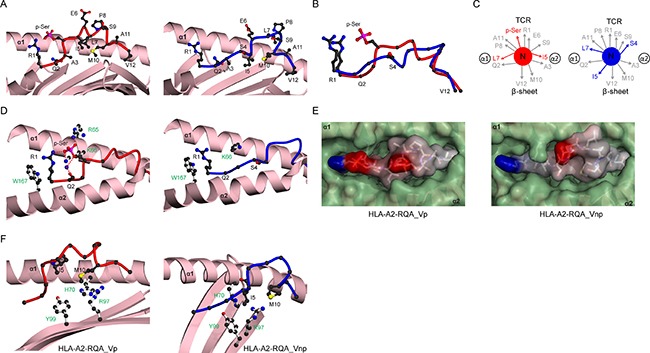
Figure 4. Structural rearrangement of RQA_V phosphopeptide upon phosphorylation.

(A) HLA-A2 bound structures of RQA_Vp (left, red) and RQA_Vnp (right, blue), derived from Lymphocyte specific protein 1. The α1-α2 antigen binding platform is shown in ribbon representation (pink), with α2 helix residues 137-166 omitted for clarity. (B) Superposition of the RQA_V main chain structures for phosphorylated (red) and non-phosphorylated (blue) peptides, including the R1 and S4/p-Ser side-chains. (C) Side-chain orientation for phosphorylated (left, red) and non-phosphorylated (right, blue) RQA_V peptides, as viewed along the long axis of the peptide from its N-terminus. Side chains which exhibit substantial changes in orientation upon phosphorylation are highlighted in red. (D) Interactions of position 4 side-chains for phosphorylated (left, red main chain) and non-phosphorylated (right, blue main chain) peptides with HLA-A2 α1-α2 helices (pink). Hydrogen bonds are indicated by red dashed lines; the blue sphere represents a sodium atom; for clarity the underlying β-sheet is omitted. HLA-A2 side chains are shown as white sticks and labelled green. (E) Molecular surface of phosphorylated (left) and non-phosphorylated (right) RQA_V peptides in complex with HLA-A2, as viewed from the perspective of the TCR. The α1-α2 molecular surface is shown in green, whereas the peptide surface is coloured according to electrostatic potential (blue, positive; grey, neutral; red, negative). The potential scale ranges from -7 (red) to +7 (blue) in units of kT/e. (F) Altered positioning of I5 in RQA_Vnp (right, blue) allowing additional contacts to HLA-A2 side-chains R97, H70 and Y99, relative to RQA_Vp (left, red), none of which are observed in RQA_Vp. The peptide binding platform is shown in ribbon representation (pink), with the α2 helix omitted for clarity.
