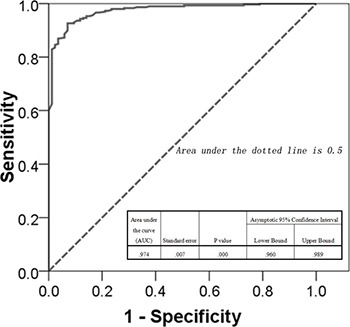
Figure 1. ROC curve of our model (AUC = 0.974).

The values calculated by our model were used as the predictors, and the outcome indicators were set as reference measure. The curve was produced by using ROC module of SPSS20.0 software, which illuminating the predicting accuracy of our model.
