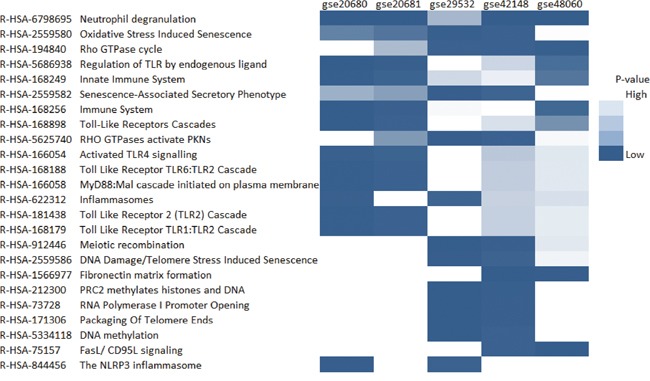
Figure 3. The heatmap of enriched pathways from Reactome.

Only the pathways which were significantly enriched with the cutoff of FDR lower than 0.05 in at least two datasets were shown in the plot.

Only the pathways which were significantly enriched with the cutoff of FDR lower than 0.05 in at least two datasets were shown in the plot.