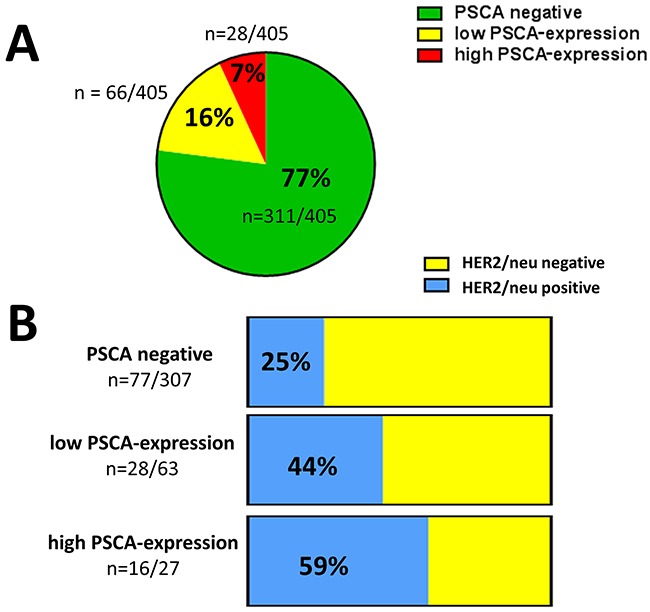
Figure 3. PSCA-expression in breast cancer and its association with HER2/neu status.

(A) The pie chart shows the proportion of low and high PSCA-expression among the studied breast cancer patients according to TMA-analysis. (B) The stacked columns show the relative distribution of HER2/neu positive and HER2/neu negative patients with regard to the PSCA-status. Absolute patient numbers of each subgroup are indicated.
