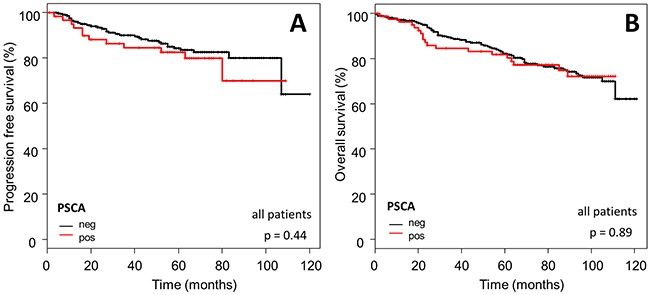
Figure 4. Prognostic relevance of PSCA-expression in the total breast cancer population.

The Kaplan-Meier plots show (A) progression-free survival and (B) overall survival of the total study population with PSCA-positive (red curves) vs. PSCA-negative tumors (black curves).
