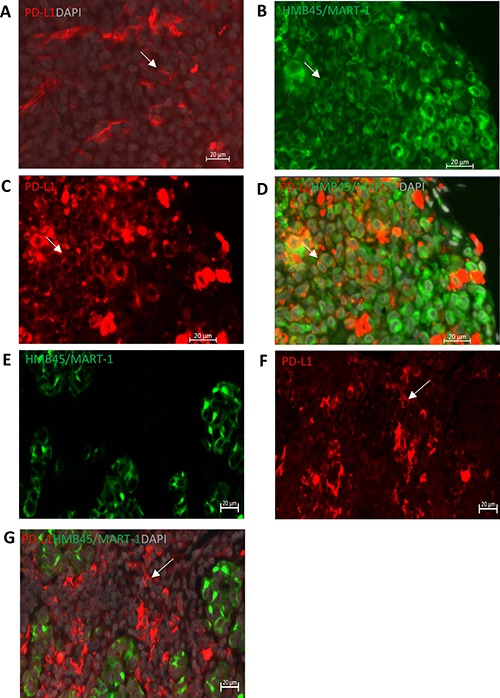
Figure 1. PD-L1 expression in primary CM as determined by IF analysis.

(A) Positive membranous PD-L1 (red) staining in the positive control, human tonsil tissue. (B–D) Representative images of HMB45/MART-1 (B, green, cytoplasmic/membranous), PD-L1 (C, red, membranous) and double staining (D) with DAPI (grey), show that PD-L1 is expressed on CM cells. (E–G) PD-L1 is expressed on HMB45/Mart-1 negative stromal cells. Scale bar is 20μm. White arrows indicate the positive cells.
