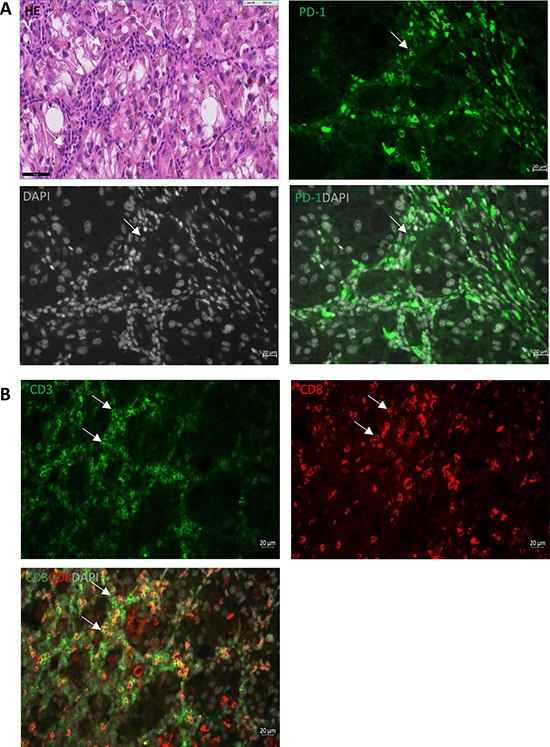
Figure 3. PD-1 expression in CM.

Representative immunohistological staining shows that: (A) PD-1 (green, membrane) is expressed on stromal cells surrounding the primary tumor areas (white arrows); (B) staining of CD3 (green) and CD8 (red) demonstrates these stromal cells are T cells (white arrows). Scale bar of IF is 20 μm, and of HE is 50 μm.
