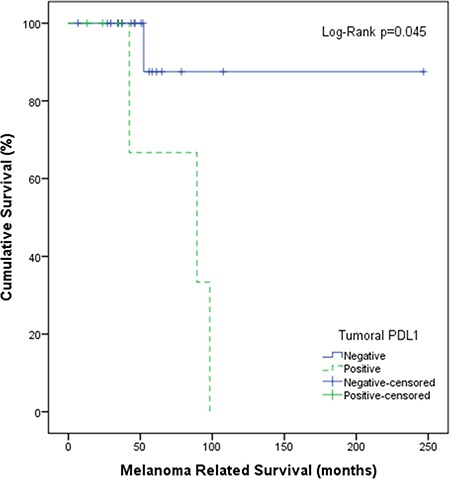
Figure 4. Survival analysis according to PD-L1 status in CM.

Kaplan-Meier plot shows disease-specific survival of patients with PD-L1-positive tumors (green, dotted) and negative tumors (blue, continuous) (cut-off at 5%). P-value has been calculated using the log-rank test.
