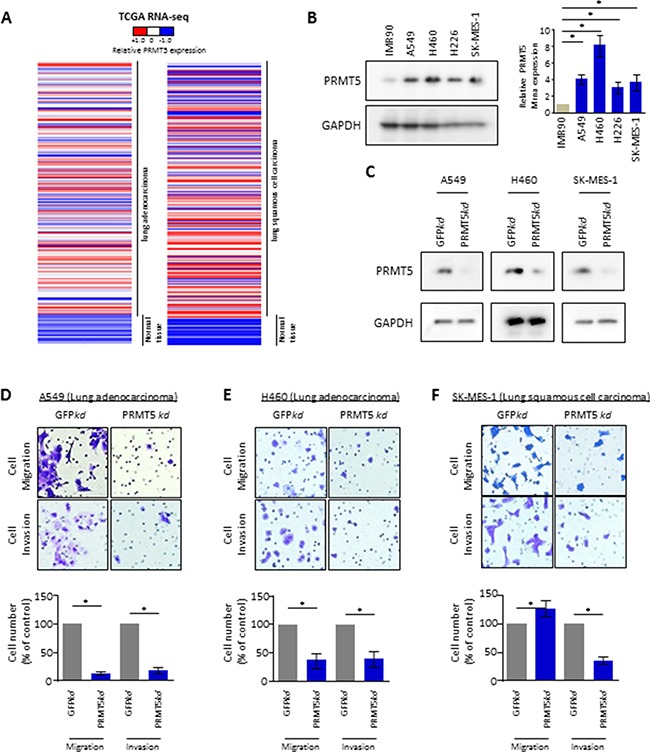
Figure 3. PRMT5 blocked lung cancer cell migration and invasion.

(A) Heat map depicting gene expression of PRMT5 from RNA-Sequencing data with lung adenocarcinoma (LUAD, normal tissues vs tumor tissues) or squamous cell carcinoma (LUSC, normal tissues vs tumor tissues) in The Cancer Genome Atlas (TCGA). Expressions of PRMT5 are ranked by sample types. RNA-Seq values are shown by indicated bar. (B) PRMT5 expression profile in lung normal fibroblast cells and lung cancer cell lines. (Left panel) Whole cell lysate immunoblots for PRMT5 and GAPDH (loading control). (Right panel) qRT-PCR for relative mRNA levels of SHARPIN. β-Actin was used as an internal control. Values are means ± S.E.M. of three independent experiments. *p < 0.05 from one-way ANOVA test. (C) Confirmation of depletion of PRMT5 in lung cancer A549, H460 and SK-MES-1 cell lines. Immunoblots for PRMT5 and GAPDH as control, from indicated cells infected with shRNA targeted against negative control (NC) or against SHARPIN. (D–F) Cell migration and invasion assays for lung cancer cell line (D) A549, (E) H460 and (F) SK-MES-1 with depletion of GFP (ctr) or PRMT5. Representative crystal violet staining of invaded cells (upper panel) through a phase-contrast microscope (20X) is shown. Quantification of the invaded cells is shown (down panel). Values are mean ± S.E.M. of three independent experiments. *p < 0.05 from one-way ANOVA test.
