
Figure 4. Improvement of M1/M2 ratio by decrease of M2-like CD206+ TAM in tumor in vivo.
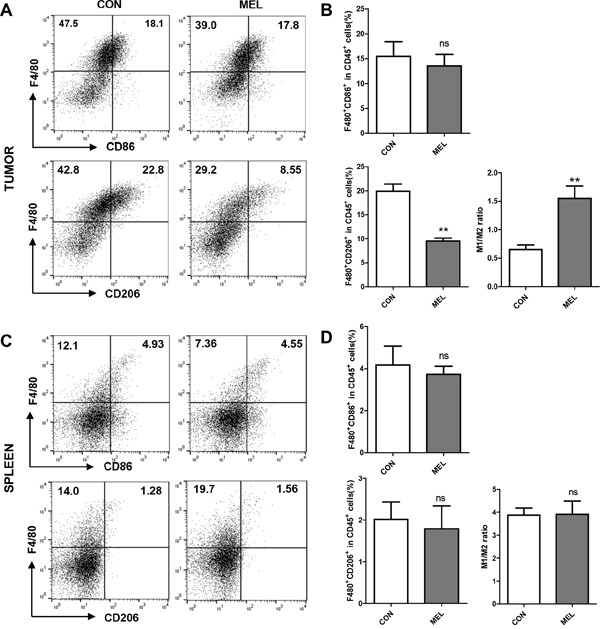
(A-B) M1-like macrophages that infiltrated tumor cells were marked as F4/80+CD86+ (upper panel), and M2-like TAMs were marked as F4/80+CD206+ (lower panel). (C-D) F4/80+CD86+ and F4/80+CD206+ macrophages in splenocytes are shown. The M1/M2 ratios were calculated based on the dot plots of CD86+ (M1) and CD206+ (M2) cells in F4/80+ macrophages. All plots were gated on CD45+ cells from total live gated cells. The values are presented as the mean ± SEM; ** P <0.01.