
Figure 7. Effect of melittin treatment on the tumor angiogenic network.
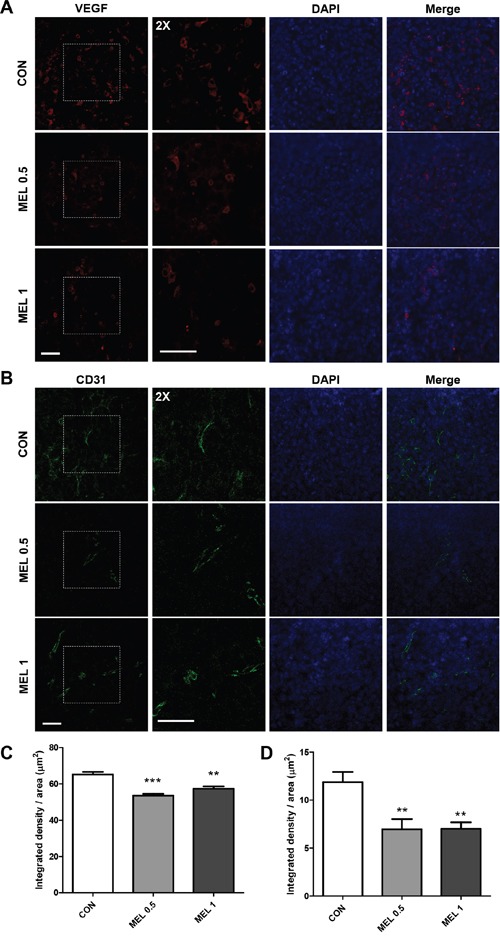
(A) VEGF (red) and (B) CD31 (green) positive cells were visualized with immunofluorescence staining in a paraffin sectioned tumor. The nuclei were counterstained with DAPI (blue). (C-D) The intensity of VEGF (C) and CD31 (D) were quantified by image J. The data are presented as the mean ± SEM; **P < 0.01, *** P < 0.001, versus the corresponding control group. Total magnification, 400X. Scale bars, 50 μm.