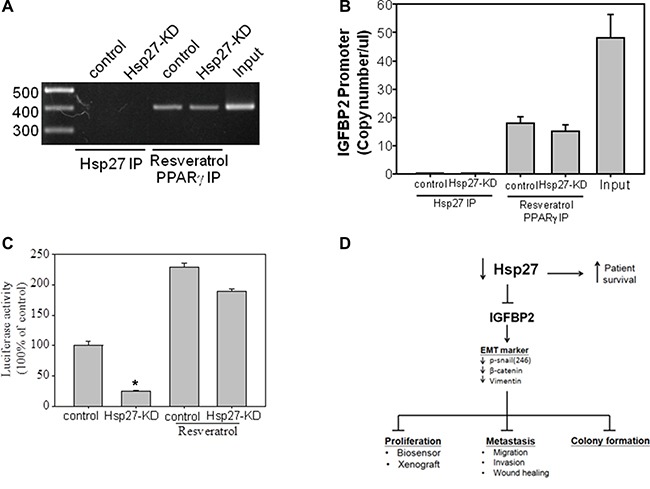
Figure 9. IGFBP2 expression and transcriptional regulation in HCC cells.

(A) IGGBP2 protein expression in five HCC cell lines. (A) A ChIP assay of the IGFBP2 promoter region was performed using the Hsp27 antibody in HepJ5 and HepJ5 Hsp27-KD cells. Resveratrol, which induces PPARγ activation at the IGFBP2 promoter region, was used as a positive control. The IGFBP2 promoter region from −732 to −343 was amplified by PCR from the eluents from each group and analyzed by agarose gel electrophoresis. (B) Real-time PCR (Q-PCR) quantitative curve of the eluents from the IGFBP2 ChIP assay. IGFBP2 promoter fragments were measured and compared by Q-PCR analysis. (C) The IGFBP2 luciferase assay used the PGL3 vector containing the IGFBP2 promoter region from −1265 to +465. Post IGFBP2-PGL3 transfection on Hep-J5 and Hep-J5 Hsp27KD cells, the luciferase activities were measured and normalized with RLTK activity. The luciferase activity from empty vector was defined as a one-fold. *indicates p < 0.05. (D) Schematic of Hsp27 regulation in HCC.
