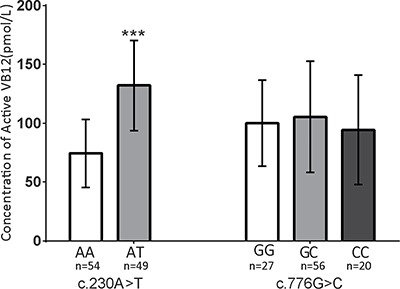
Figure 1. The c.230A>T allele correlates with the concentration of active VB12 (holo-TC) in human plasma.

The concentrations of holo-TC were measured within women with different genotypes. Plasma from AA:AT:TT = 54:49:0 individuals at c.230 and GG:GC:CC = 27:56:20 individuals at c.1025 were tested. The color coding used in the figure for each genotype is as follow, on the left side: white-AA, gray-AT; on the right side: white-GG, gray-GC, black-CC. The levels of holo-VB12 were significantly different between the individuals with different genotypes at c.230 A>T locus, but not at c.1025 G>C. Data are shown as mean ± SD. ***P < 0.001. (c.230 A>T: AA = 74.4 ± 29.0 pmol/L, AT = 132.1 ± 38.4 pmol/L; c.1025 G>C: GG = 100 ± 36.6 pmol/L, GC = 105.4 ± 47.3 pmol/L, CC = 94.4 ± 46.5 pmol/L).
