
Figure 5. Involvement of 4E-BP1 in response to pasireotide, octreotide, or everolimus alone or in combination.
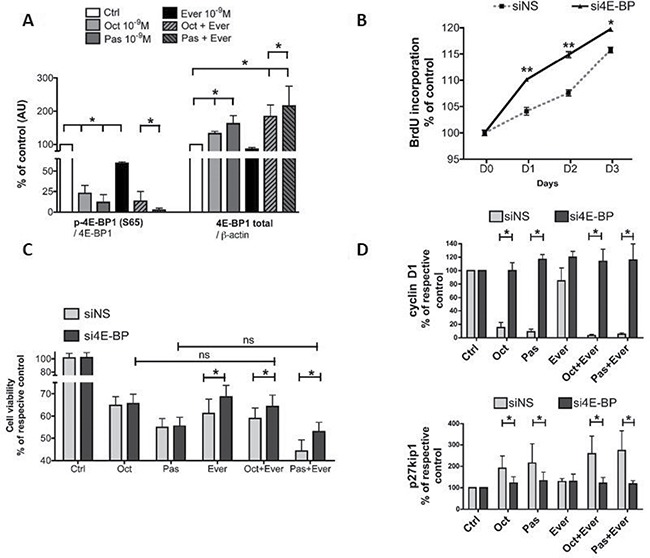
(A) Western blot analysis of 4E-BP1 phosphorylated on Ser65 [p-4E-BP1(S65)] and total 4E-BP1 (4E-BP1) after overnight incubation with 10−9 M pasireotide, octreotide, and everolimus, or combined treatment. Quantification of p-4E-BP1(S65) (reported to total 4E-BP1) and total 4E-BP1 (reported to β-actin). The results are represented as the mean percentage of controls (nontreated) obtained from three tumors (two WHO grade I and one WHO grade III); *p < 0.05. oct: octreotide, pas: pasireotide, ever: everolimus. (B) Impact of 4E-BP1 siRNAs on the cell proliferation of six meningioma samples (three WHO grade I and three WHO grade II) transfected with either nonspecific (siNS) or 4E-BP1 (si4E-BP) siRNA at 10 nM. Cell proliferation curves for 3 days of siNS cells and si4E-BP1 cells were obtained using BrDU incorporation. The results are represented as the mean percentage at day zero obtained from two tumors; *p < 0.05; **p < 0.01. (C) 4E-BP1 blocking by siRNA partially reversed the impact of treatment with 10−9 M pasireotide or octreotide combined with everolimus. Cell viability was measured by Cell Titer Glo 48 h after transfection. The results are represented as the mean percentage of each respective control (without drug treatment, ctrl) *p < 0.05. (D) 4E-BP siRNA reversed the impact of SSA alone or in combination with everolimus on cyclin D1 and p27kip1 expression levels. Cyclin D1/ β-actin and p27kip1/ β-actin expression levels were analyzed by western blotting. The results are represented as the mean percentage of each respective control. ctrl: control; oct: octreotide; pas: pasireotide; ever: everolimus; *p < 0.05.