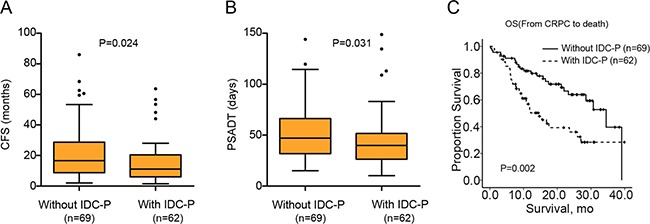
Figure 1. Differences of CFS, PSADT and OS between IDC-P(+) and IDC-P(–) patients.

(A) Box plots of CFS between patients with and without IDC-P; (B) Box plots of PSADT between patients with and without IDC-P; (C) Kaplan-Meier curves of OS between patients with and without IDC-P.
