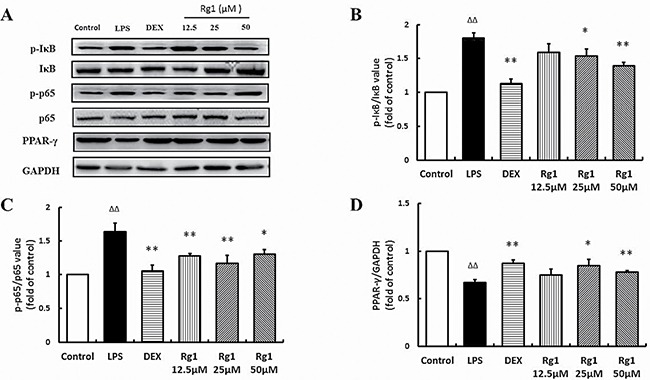
Figure 7. Effects of Rg1 on p-IκBα, p-p65, and PPAR-γ protein expression in RAW264.7 cells treated with LPS.

(A) Western blot bands; (B) p-IκBα expression; (C) p-p65 expression; (D) PPAR-γ protein expression. Data are expressed as mean ± SD, n = 3 for each group. *P < 0.05 and **P < 0.01 versus LPS; ΔΔP < 0.01 versus control.
