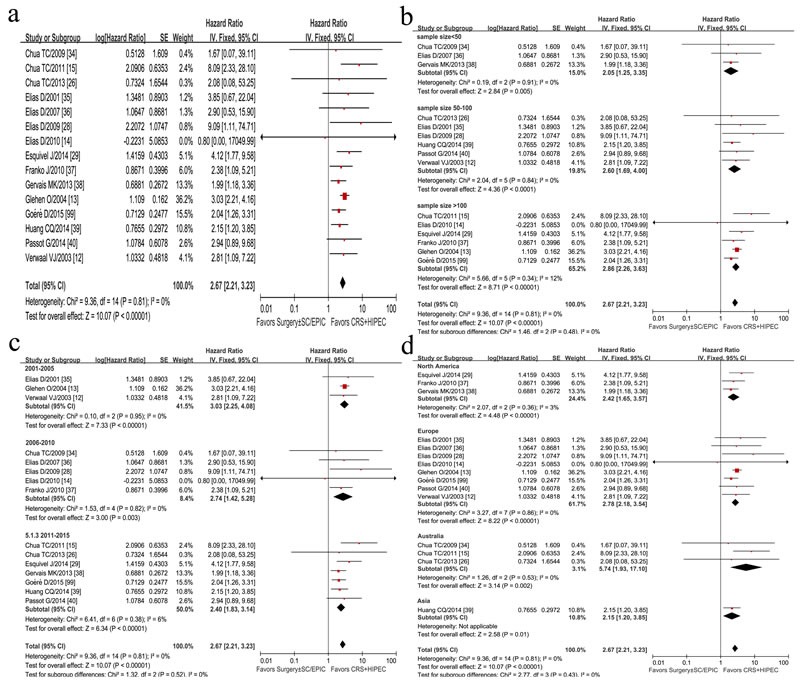
Figure 2.

Forest plots of 15 studies displaying the results of the meta-analysis on hazard ratios (HR) for overall survival (OS) (a); Sensitivity analysis of sample size difference (b), published-time difference (c), and geographic-distribution difference (d).
