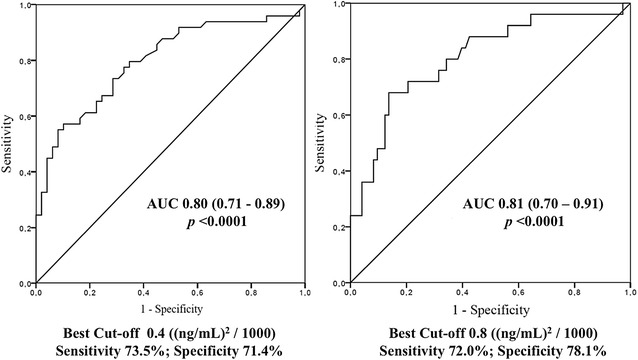
Fig. 3.

ROC curve for the worst [TIMP-2]·[IGFBP7] index to predict AKI and AKIN ≥ 2. ROC curve and area under the curve (AUC) for the worst [TIMP-2]·[IGFBP7] index concentration within the first 12 h of ICU admission to predict AKI (left) and AKIN ≥ 2 (right)
