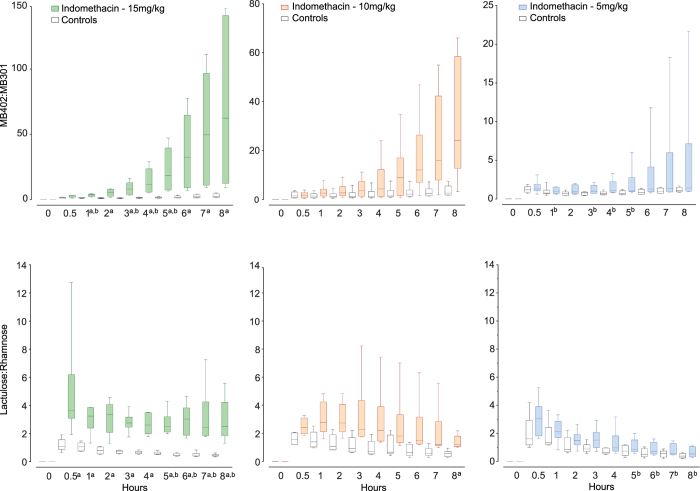
Figure 2.
Urinary ratios of gavaged tracers. Ratios of tracers (Y-axes) in urines are plotted against time after gavage (X-axes). Note different scales on Y-axes for the fluorophores as indomethacin doses change. Box plots (generated in GraphPad Prism ver 7) portray medians and interquartile ranges with min and max whiskers for each point, for rats challenged with doses of indomethacin as indicated (colored boxes), and their same-day controls administered vehicle alone (open boxes). Fluorophore ratios are presented in the top row, with the Y-axis scales varying across challenge doses. Lactulose: rhamnose ratios are presented in the bottom row, with constant Y-axis scales. All sampling points present data from six challenged and six same day control rats, except for two time points in rats tested with the sugar tracers after intermediate dose challenge (details in statistics section). ap < 0.0125 challenged rats vs. same-day control rats; bp < 0.0125 high-dose vs. low-dose challenged rats. P-values for each comparison are provided in Supplementary Table S2, which also notes adjustment methodology for multiple corrections.

