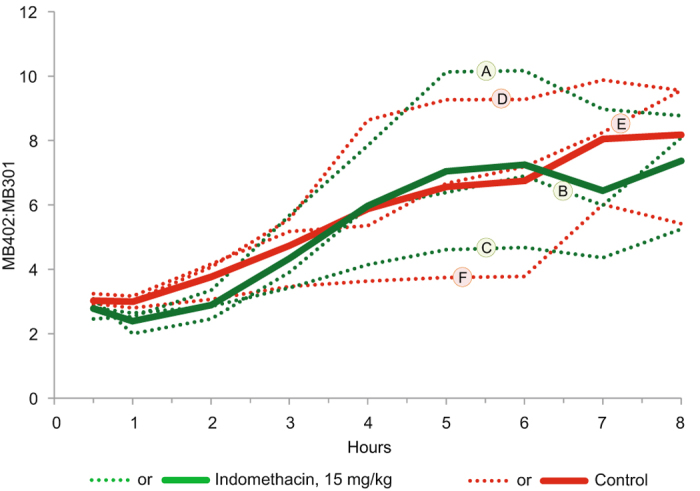
Figure 3.

Clearance of intravenously administered fluorophores. Y-axis portrays urinary MB-402: MB-301 ratios in rats that had been gavage challenged with high-dose indomethacin or vehicle alone one day earlier (three challenged and three control rats). X-axis portrays timing of urine samples after intravenous injection of the fluorophores. Green and red dotted lines represent urinary ratios of individual challenged or individual control rats, respectively. Solid lines represent the corresponding arithmetic means of these ratios at each sampling. Letters correspond to the numbers for the same rats in Supplementary Fig. S3.
