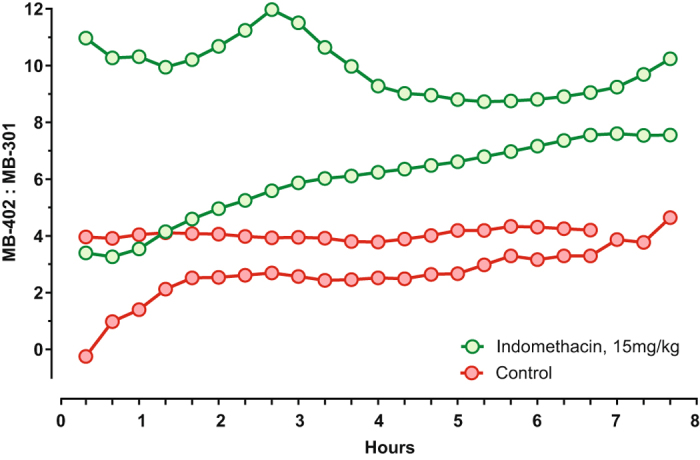
Figure 4.

Continuous transcutaneous tracing of enterally administered MB-402 and MB-301. MB-402: MB-301 ratios (Y-axis) were determined over time (X-axis) after fluorophore gavage. One day earlier, two rats were challenged with high-dose indomethacin (green lines and circles) and two rats were challenged with vehicle alone (red lines and circles). Measurements are truncated for one control rat because it died an hour before the experiment ended.
