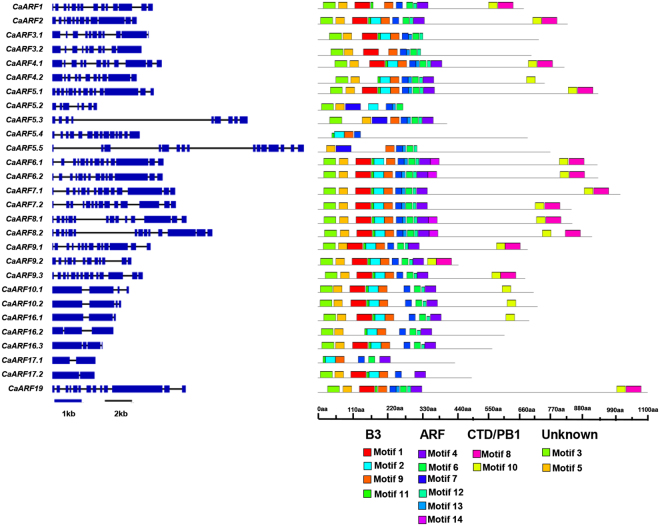
Figure 2.
Gene structure and motif organization of ARF genes in chickpea. Left panel illustrates the exon–intron organization of ARF genes. Exons and introns are represented by boxes (blue) and lines (black), respectively. Right panel shows motif organization in ARF proteins. Motifs 1, 2, 9 and 11 represent B3-domain; Motifs 4, 6, 7, 12, 13 and 14 represent ARF-domain; Motifs 8 and 10 represent PB1-domain; Motifs 3 and 5 are unknown novel motifs.

