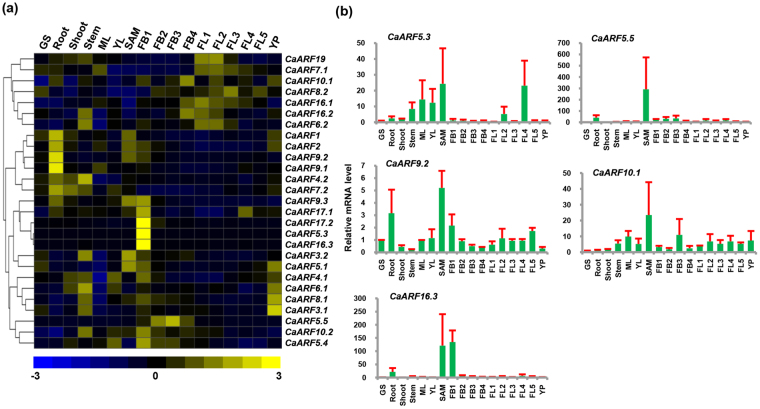
Figure 4.
Expression profiles of CaARF genes in different tissue/organs. (a) Heatmap showing the normalized RNA-seq expression (FPKM) transformed into Z-score. Hierarchical clustering was conducted in R using the pheatmap package with dissimilarity metrics based on Euclidean distance with complete linkage rule. Color key at the bottom represents row wise Z-score. (b) RT–qPCR analysis of CaARF genes in various tissue/stages of development. Expression of germinating seedling (GS) was taken as a reference to determine relative mRNA level in all other tissues for each gene. Error bars indicate standard error (SE) of mean. GS, germinating seedling; ML, mature leaf; YL, young leaf; SAM, shoot apical meristem; FB1–4, stages of flower bud; FL1–5, stages of flower; YP, young pod.

