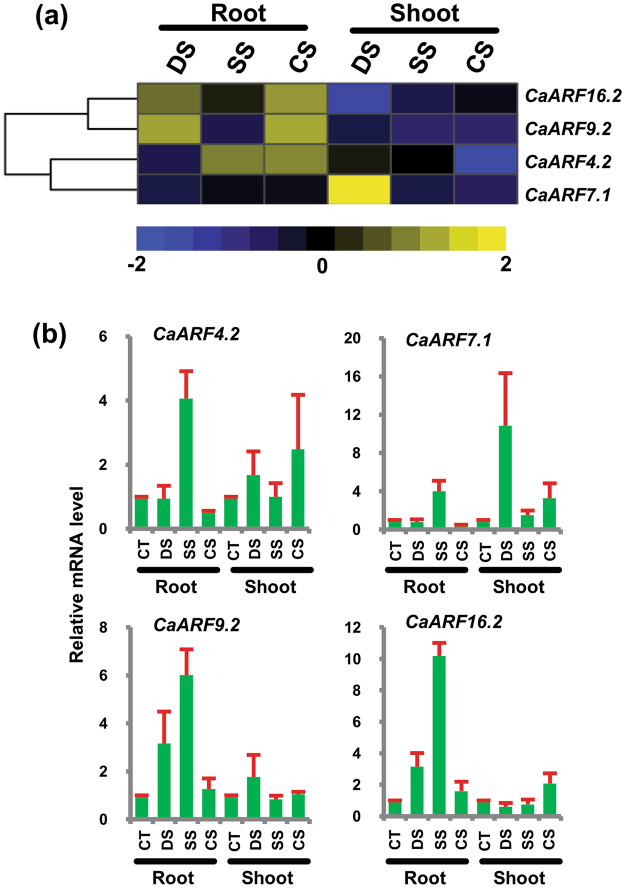
Figure 5.
Expression profiles of CaARF genes under abiotic stress conditions. (a) Heatmap showing differential expression of CaARFs based on RNA-seq data. Color key at the bottom represents log2 fold change. (b) RT–qPCR analysis of CaARF genes under various stress treatments. Root and shoot control were taken as a reference to determine relative mRNA level under stress conditions. Error bars indicate standard error (SE) of mean. DS, desiccation; SS, salinity; CS, cold stress, CT, control.

