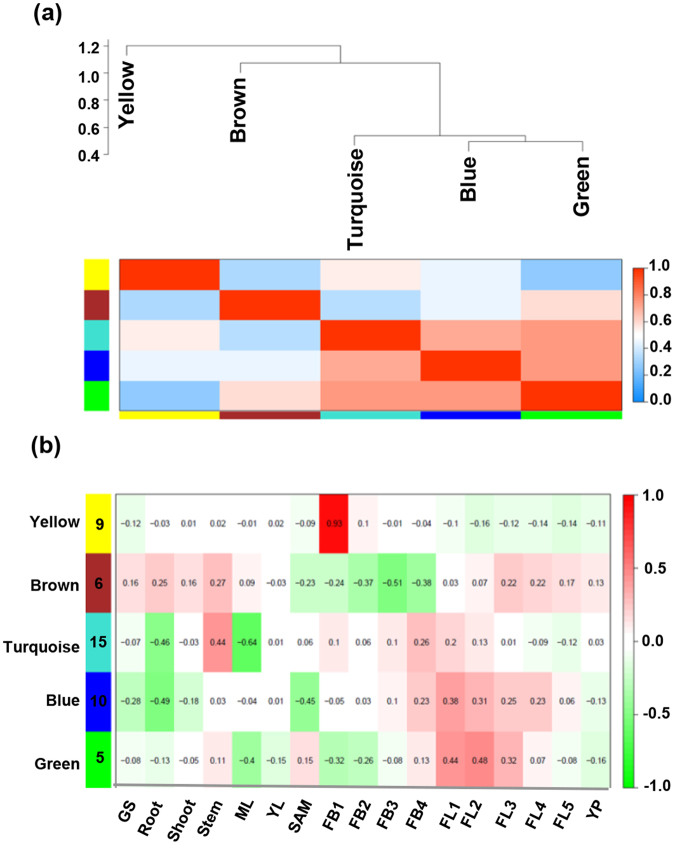
Figure 6.
Co-expression network analysis of CaARF, CaIAA and CaGH3 genes. (a) Cluster dendrogram showing correlation (0 to 1) between the modules. A high degree of correlation between modules is indicated by dark red color. (b) Module tissue correlation. Each row corresponds to a module. The number of genes in each module is indicated on the left. Each column corresponds to specific tissue labeled below. The color of each cell at row-column intersection indicates the correlation coefficient from −1 to 1. A high degree of correlation between a specific module and the tissue-type is indicated by dark red.

